
In recent years, the IT world has been steadily moving to the cloud. Many companies have migrated their data to the cloud, convinced that this step could have a substantial impact on managing costs. This, however, is an illusion, and once it vanishes, people realize that although cloud infrastructure can be very flexible, costs can be highly variable. The word “scalable” often comes up in relation to the cloud, but how easy is it to predict the impact of scalability on costs? In this way, the cloud has driven a full collaboration between finance and operations (FinOps), to predict as precisely as possible how much IT management will spend.
Financial management tools are not always able to adapt to the logic of the cloud, and many companies operate systems designed for on-premises repositories, which prevents them from understanding exactly what value is obtained from cloud investments. But they understand the need to increase their ability to forecast and optimize spending to manage this complex situation and ensure the economic sustainability of cloud IT environments.
To fully monitor and optimize hybrid and multi-cloud information systems and rationalize spending on cloud services, which are fundamental for IT management planning, companies are adopting cost optimization strategies based on actual consumption and the continuous monitoring of consumption, services, and users.
The Financial Operations (FinOps) Methodology
The FinOps methodology refers to a set of practices that combine finance, technology, and business strategies to optimize cloud spending within an organization. It involves managing and controlling costs associated with cloud computing by aligning expenses with actual usage and business needs. FinOps aims to bring together different teams, such as finance, engineering, and operations, to collaborate on cloud cost optimization without sacrificing performance or innovation. This practice involves monitoring, analyzing, and optimizing cloud spend, often leveraging tools and methodologies to monitor and more efficiently allocate costs.
The Denodo Platform offers timely, precise dashboards that analyze traffic to and from the cloud, to keep cloud costs under control.
How To Understand Cloud Cost with the Denodo Platform
Being infrastructurally located at a central point, the Denodo Platform offers a unique vantage point on all enterprise-wide data and analytics activities.
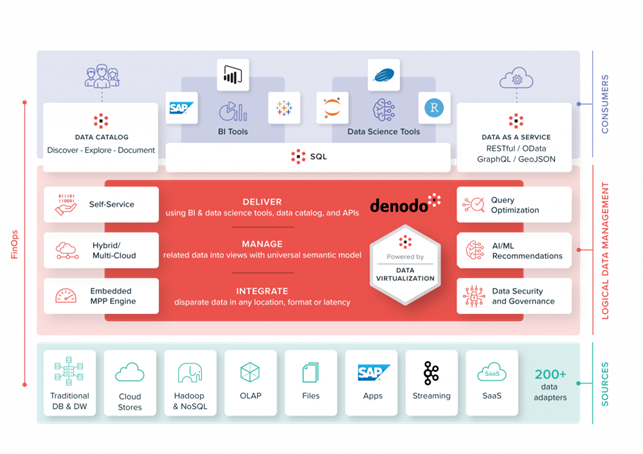
With the Denodo Platform update dated September 2023, a series of FinOps management capabilities were introduced.
The Denodo Platform provides monitoring capabilities through its logging and monitoring features, which enable users to track and analyze aspects of performance, usage, and operations. Denodo Platform logs can be instrumental in troubleshooting, optimizing performance, and ensuring the health and stability of the environment, and from September 2023 on, they have also been instrumental in monitoring costs. (Artificial intelligence is also applied to these logs, but this will be covered in a subsequent post.)
With these new capabilities, it is now possible to register the various connections to the data sources created in the Denodo Platform with the cloud-of-origin and the region-of-origin. It is also possible to register the data sources of an on-premises data center, so the Denodo Platform can control the data flow throughout the entire data infrastructure.
The Denodo Platform contains detailed metadata, data transfer metrics, and computation statistics, and it can combine all of this data with details about where each source system resides.
With this FinOps data, it is possible to activate the Dashboards that the Denodo Platform makes available to its customers based on the Apache Superset, and it will also be possible to set up a virtual database dedicated to performance and FinOps monitoring.
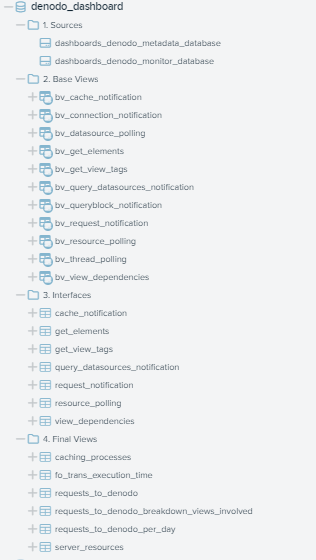
We will create a variety of dashboards for our daily use as well as dashboards totally dedicated to FinOps.
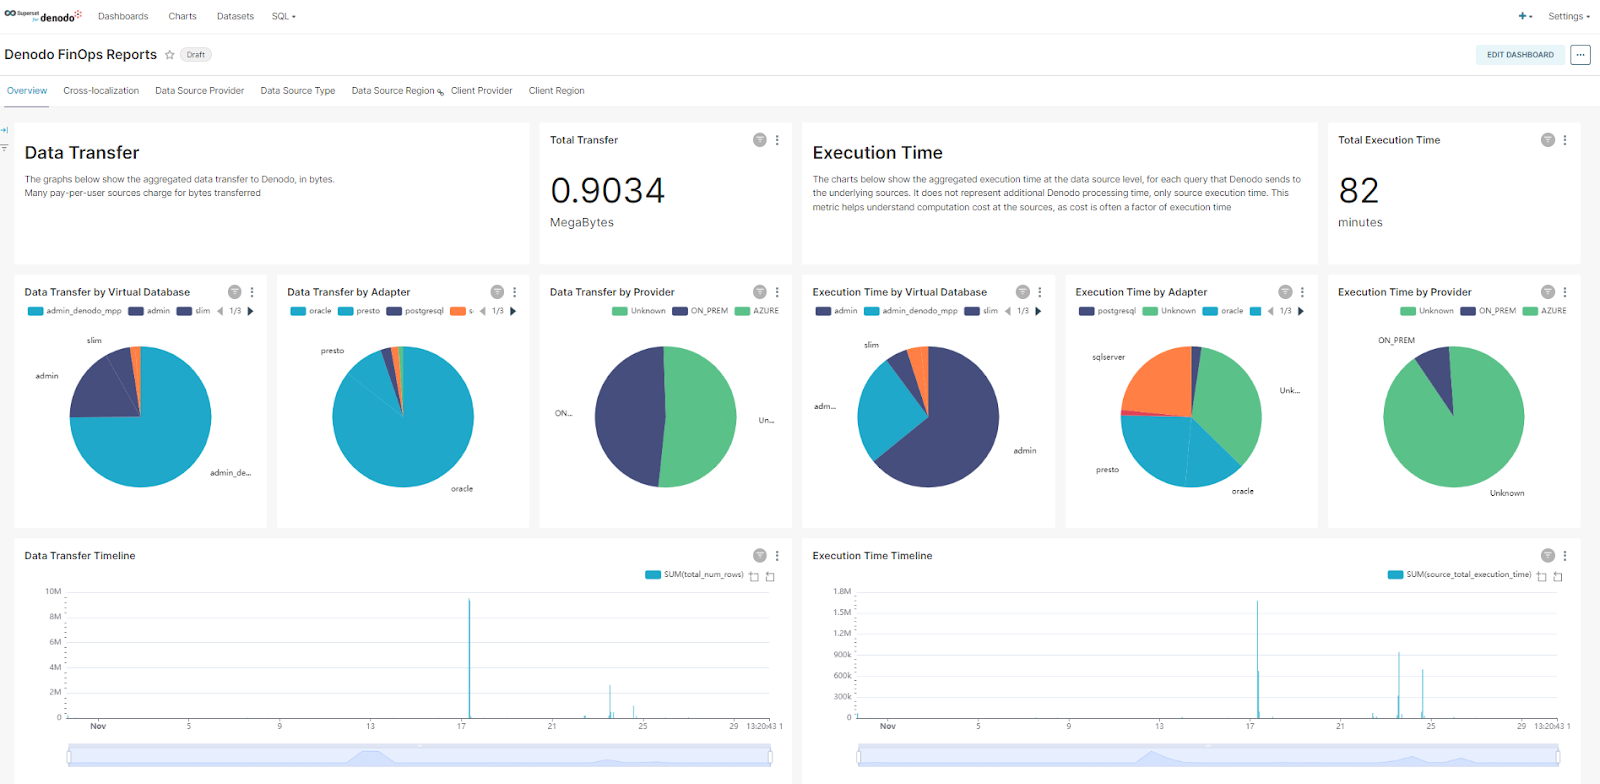
Denodo FinOps dashboards collect and visualize details across a wide variety of dimensions, including information on bytes transferred, in-query execution, indicators of compute-intensive workloads examining CPU time in data sources, all bytes scanned into data sources, and more.
With this information, organizations can improve:
Cost Optimization:
Denodo FinOps dashboards enable companies to optimize cloud and data infrastructure costs. For companies that handle large volumes of data, expense control is critical. Companies can now effectively monitor and optimize Cloud resource spending.
Resource Efficiency:
Efficient resource allocation is vital in the world of data management. With Denodo FinOps dashboards, companies can quickly identify underutilized resources that can be immediately reallocated. As a result, processes will run more smoothly and economically.
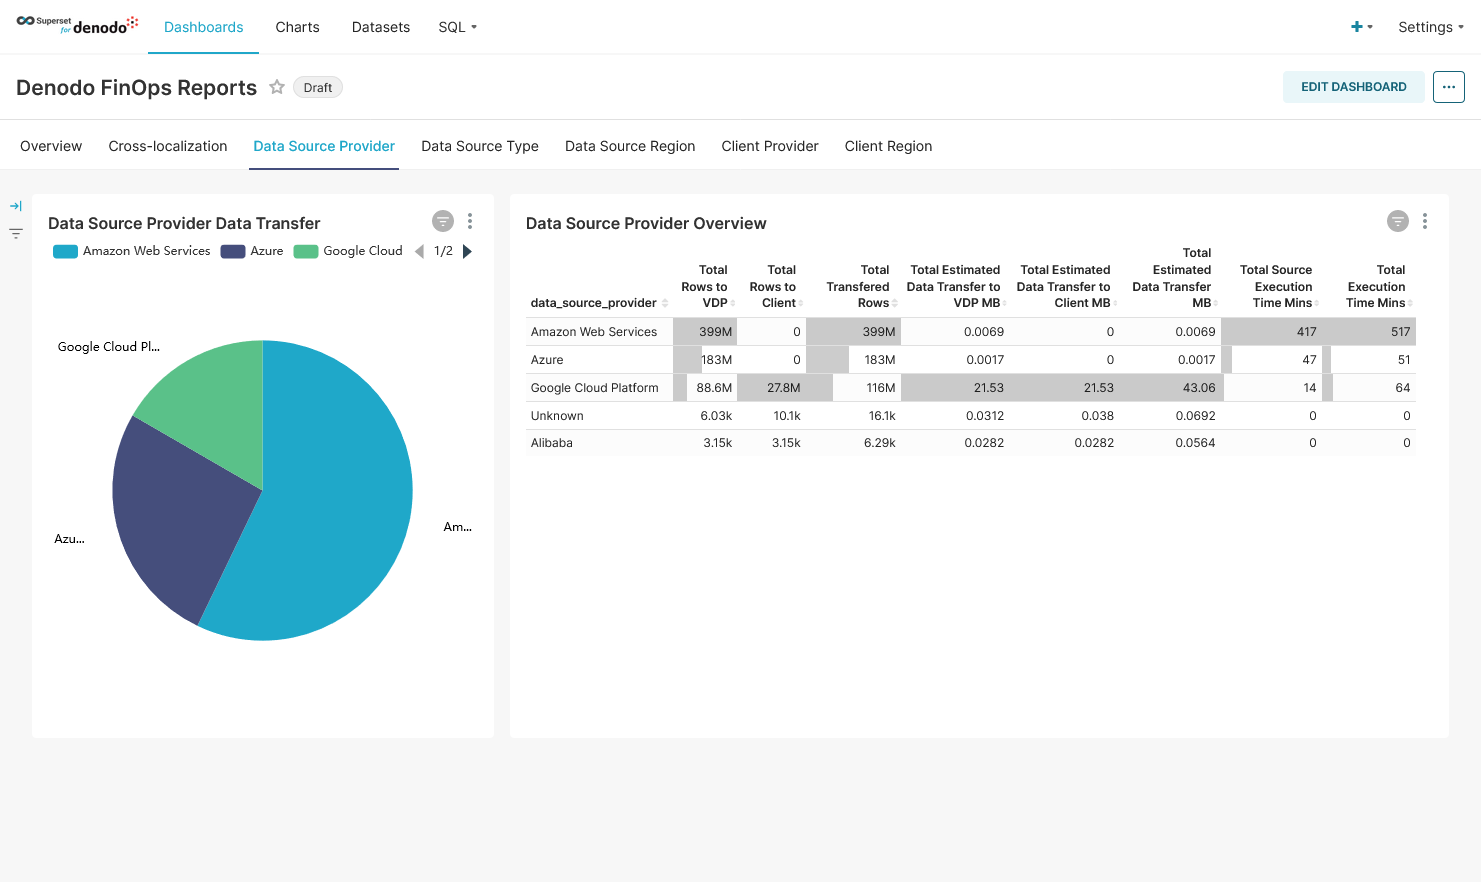
Cost Transparency and Budget Responsibility:
Understand the usage patterns of each department. Denodo FinOps dashboards promote cost transparency by breaking down expenses. Companies can choose to use this information to charge costs to the different teams that use the data, to better optimize costs.
User Engagement:
By tracking user interactions with data and various analytics tools via Denodo FinOps dashboards, companies can understand KPIs related to user engagement, adoption rates, and other key factors. With these metrics, they can demonstrate how investments meet user needs and help improve business objectives.
Controlling Cloud Costs
The FinOps methodology provides a framework for more effectively managing cloud costs, to properly balance speed, cost, and quality. With the Denodo Platform’s FinOps capabilities, users can increase the efficiency of data virtualization in the cloud, and they can continuously grow – and invest in – their cloud infrastructures without waste.
Thanks for sharing and helpful blog,