
In his recent blog post, Angel Vina, the founder and CEO of Denodo Technologies, introduced the Denodo Coronavirus Data Portal (CDP). He talked about why we, as a company, undertook this initiative to help fight the Coronavirus pandemic. Angel explained how the Data Portal is free for anyone to access and use and how you can contribute back to the initiative by suggesting data sets or contributing your own derived data sets to be shared with others through the Data Portal.
The Data Portal has been seeded with datasets gathered from over 40 different organizations around the world. These organizations, who have generously shared their data to help in the fight against the Coronavirus pandemic, include:
| ● ACAPS | ● Ministry of Health, Labor and Welfare, Japan |
| ● Allen Institute for AI | ● National Institute for Health (NIH) – National Library of Medicine (NLM) |
| ● ArcGIS Hub | ● Netherlands National Institute for Public Health and the Environment (RIVM) |
| ● Australian Bureau of Statistics, Labor Force Survey | ● New York City Department of Health and Mental Hygiene (DOHMH) |
| ● California Health and Human Services (CHHS) | ● Organization for Economic Co-operation and Development (OECD) |
| ● COVID19-India (covid19india.org) | ● Office for National Statistics, UK |
| ● Data Science for Social Impact Research Group (DSFSI), University of Pretoria | ● Public Health England |
| ● Dipartimento della Protezione Civile, Italy | ● Robert Koch Institute (RKI) |
| ● European Centre for Disease Prevention and Control (ECDC) | ● RSS News Feeds |
| ● Federal Ministry of Social Affairs, Health, Care and Consumer Protection (BMSGPK), Austria | ● San Francisco Department of Public Health (SFDPH) |
| ● French Government Open Data (data.gouv.fr) | ● Servicio Publico de Empleo Estatal (SEPE), Spain |
| ● GlobalHealth 50/50 | ● Statista.com |
| ● Google – COVID-19 Community Mobility Reports | ● Statistics Canada |
| ● Hong Kong Department of Health | ● Taiwan Centers for Disease Control |
| ● Humanitarian Data Exchange | ● Texas Department of State, Health Services |
| ● Institute for Health Metrics and Evaluation (IHME) | ● Thailand Department for Disease Control |
| ● Johns Hopkins University (JHU) Center for Systems Science and Engineering (CSSE) | ● The COVID Tracking Project |
| ● Kaiser Family Foundation (KFF) | ● The Government of the Hong Kong Special Administrative Region – Census and Statistics Department |
| ● Ministerio de Sanidad, Spain | ● The World Bank |
| ● Ministry of Health of New Zealand | ● US Department of Labor |
| ● Ministry of Health, Brazil | ● World Health Organization (WHO) |
| ● Ministry of Health, Consumer Affairs and Social Welfare, Spain |
This has resulted in over 400 datasets being available on the Data Portal – data ranging from Coronavirus cases and mortality data for different countries, states, and even counties around the world, data on population densities, poverty rates, and healthcare accessibility, data on air pollution and air quality from major urban conurbations, data on government actions to mitigate the effect of the pandemic and data on the resultant unemployment rates on different countries and regions. We’ve even got fully indexed and searchable scientific papers on COVID-19 and the Coronavirus family of viruses. There is a wealth of data already on the Data Portal and more is being added every day.
The Data Portal is an open portal and it is free for anyone to access and use the data. You can access the Data Portal in a number of different ways:
- Browse the data using the Data Catalog
- Connect to the Data Portal using your own tools to analyze the data
- Download the data for offline use
- Download or request a Denodo ‘sandbox’ to access the data portal and create your own derived data sets
Let’s look at each of these ways that you can access and use the Data Portal.
Browse the data using the Data Catalog
Browsing the data is often the first way that people use the Data Portal. The data sets in the Data Portal are all categorized and tagged to make it easier for user to browse and search for specific data. Some of the data sets, such as the COID-19 scientific papers from the National Institute of Health (NIH) and the Allen Institute, are also indexed and fully searchable in a Google-like manner. You can access the Data Catalog from the Coronavirus Data Portal landing page – simply scroll down and click in the ‘Search the Data Catalog’ button.
You can login to the Catalog using the guest credentials – they are provided for you on the login page – and start browsing the data sets. You can browse by folders, which are effectively categories of data, or by tags applied to the data sets by the Denodo data stewards.
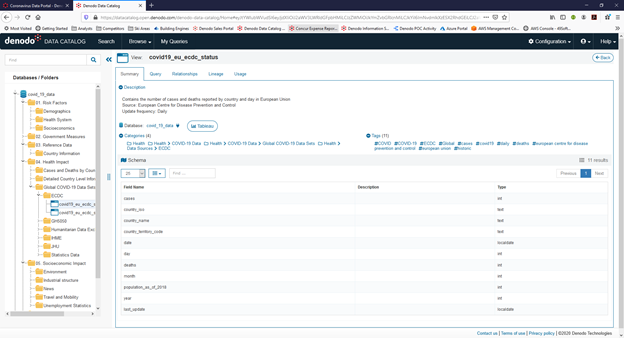
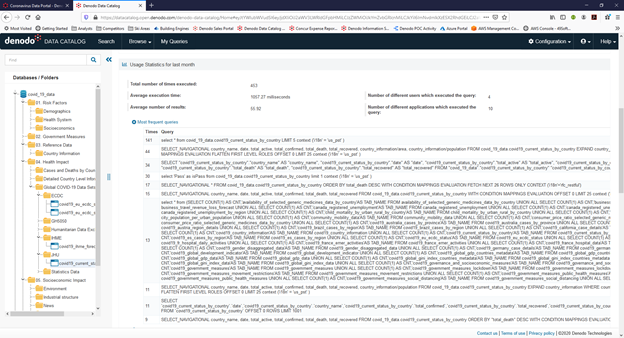
By browsing the data, you can examine interesting data sets, including the schema of the data set, relationships, lineage, etc. You can even see the usage statistics for the data set e.g.
You can also perform Google-like searches on the indexed data sets, such as the scientific research papers on COVID-19 and the Coronavirus family of viruses. The following is an example of the results of a search for ‘SARS-CoV2’ across the NIH LitCovid data set and the Allen Institute CORD19 data set of scientific papers:
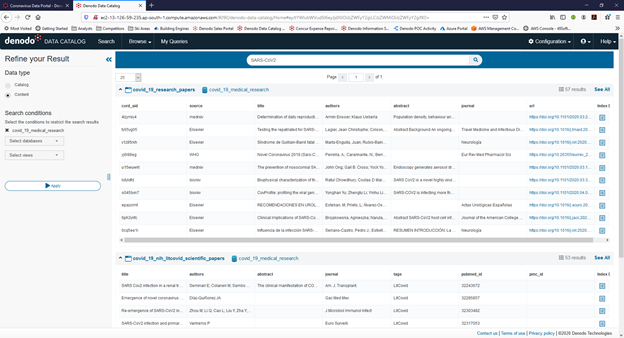
In addition to the core information, such as the title and abstract for the paper, the authors, etc., the indexed search results contain a link to the original scientific paper if you are interested in reading further.
Connecting with your own tool
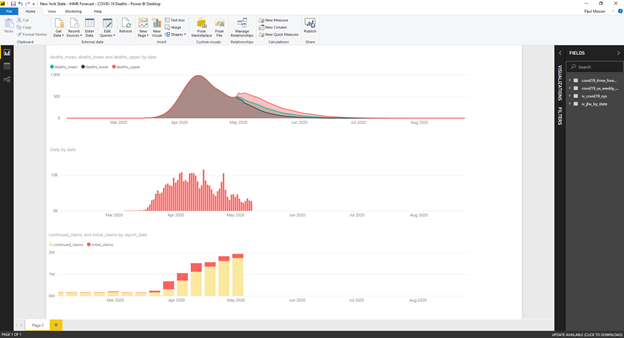
While browsing the data is very informative, it’s not necessarily the way to get the most from the data within the Data Portal. Connecting to the Data Portal with your preferred analytical or visualization tool allows you to analyze the data for the insights that you need. The Data Portal supports JDBC and ODBC connections allowing you to connect using all the common BI and visualization tools such as Tableau or Microsoft Power BI. This allows you to combine the data to suit your needs. For example, the image below is a dashboard built using Microsoft Power BI and displays forecast Coronavirus data (from IHME), daily new case data (JHU), and unemployment claims (Department of Labor) for New York state.
Information describing how to connect to the Coronavirus Data Portal is available to help guide you (and troubleshoot any issues) when you connect to using your preferred analytical tool. The information is available as a PDF document and as a video example.
If your tool doesn’t support JDBC or ODBC connectivity, you can also access the data from the Data Portal through an extensive set of REST APIs, supporting both XML and JSON format data. There are 13 REST web services providing over 150 APIs, giving access to all of the data on the Data Portal. Details for how to access the REST APIs are available on the Data Portal landing page.
Downloading the data
Connecting to the Data Portal with your analytical tool might not be the way that you want to go. You might want to download the data and work in an ‘offline’ manner. Well, you can do that as well. Using the Data Catalog, not only can you search, browse and understand the data, you can also query and download the data in a file – great if you want the data for loading into a Python machine learning script or something similar.
Querying the data – using a simple query builder in the Data Catalog – allows you to select the subset of data that you need – for example, the COVID-19 data from JHU, but limited to just New York state. The query builder allows you to select the data fields that you need, filter the data, and sort the data using an ‘ORDER BY’ clause – and all of this without having to write any SQL.
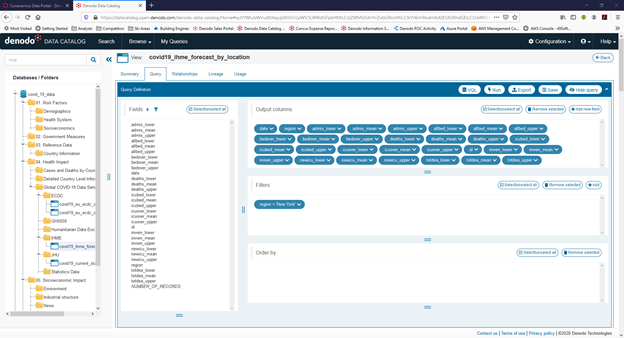
Once you have built the query to get the data that you need – and only the data that you need – you can export the results into a file. The file format options are CSV, Excel, or HTML. The file can be downloaded to your computer for offline use.
Using a Denodo sandbox
If you want to do more than just access the data in the Data Portal – if you want to use it to enrich your own data and build a derived data set, then we have got Denodo sandboxes that make this easy to do. The sandboxes are a fully functioning version of the Denodo Platform for use with initiatives related to the Coronavirus pandemic. The sandboxes allow you to connect to the Data Portal and combine the Data Portal data with your own data using a low code/no code, drag-and-drop development tool. The Denodo sandbox comes in two forms:
- A downloadable sandbox to install on your computer. This is the Denodo Express – COVID-19 Edition and can be downloaded from the Denodo Community site. You install Denodo Express on your computer and then connect to the Data Portal to access the data sets.
- A Cloud-hosted sandbox. You can request a Cloud-hosted sandbox and we will automatically provision it for you while you wait. This will give you a private Denodo sandbox environment running a Denodo Server on the AWS Cloud. You can connect to your sandbox and do everything that you can do with the downloadable sandbox.
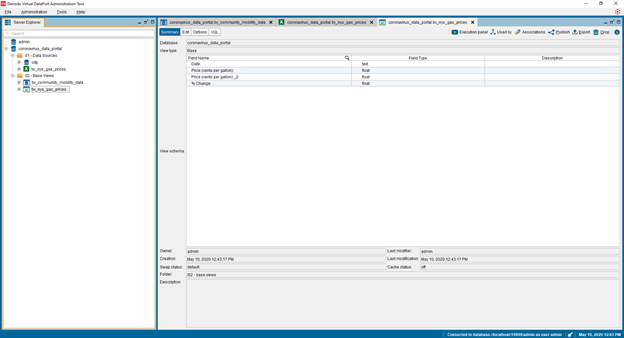
The following image shows the downloaded Denodo Express – COVID-19 Edition sandbox connected to the Data Portal to access the Google Community Mobility data and then combine that with data for gas prices in New York state, which is in an Excel spreadsheet on the local computer. This would allow us to analyze the effect of the ‘New York on Pause’ order on people’s travel habits and any subsequent effect on gas prices within the state.
Conclusion
The Coronavirus Data Portal contains a wealth of data about the Coronavirus pandemic and this data is growing daily. The Data Portal is an open portal. You are free to access and use the data – just to browse it, to analyze it, to download it, or to create derived data sets combining the data from the Data Portal with your own data.
You can contribute back to the Data Portal by suggesting data sets that should be added and shared with others. Or, if you’ve got data sets yourself, you can download or request a Denodo sandbox environment and combine the Data Portal data with your own data to create derived data sets. These derived data sets can then be contributed back to the Data Portal community for others to access and use.
The challenges posed by the Coronavirus pandemic are many – how is the virus spreading, when is it safe to re-open businesses, will there be a resurgence, and so on. By working together as a community and utilizing data to drive fact-based decisions, we will all be safer. By working together, we can address the challenges that lie ahead to make our communities a better, safer place.

- The Energy Utilities Series: Challenge 3 – Digitalization (Post 4 of 6) - December 1, 2023
- How Denodo Tackled its own Data Challenges with a Data Marketplace - August 31, 2023
- The Energy Utilities Series: Challenge 2 – Electrification (Post 3 of 6) - July 12, 2023